Pump Characteristic Curves

The performance of a centrifugal pump can be shown graphically on a characteristic curve. A typical characteristic curve shows the total dynamic head, brake horsepower, efficiency, and net positive Suction head all plotted over the capacity range of the pump.

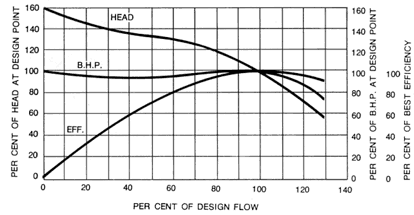
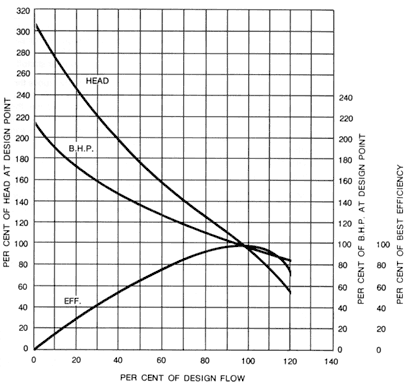
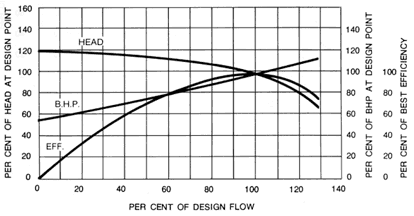
Figures 5, 6, & 7 are non-dimensional curves which indicate the general shape of the characteristic curves for the various types of pumps. They show the head, brake horsepower, and efficiency plotted as a percent of their values at the design or best efficiency point of the pump.

Fig. 5 below shows that the head curve for a radial flow pump is relatively flat and that the head decreases gradually as the flow increases. Note that the brake horsepower increases gradually over the flow range with the maximum normally at the point of maximum flow.
sect a8 fig05
Fig. 5 Radial Flow Pump


Mixed flow centrifugal pumps and axial flow or propeller pumps have considerably different characteristics as shown in Figs. 6 and 7 below. The head curve for a mixed flow pump is steeper than for a radial flow pump. The shut-off head is usually 150% to 200% of the design head, The brake horsepower remains fairly constant over the flow range. For a typical axial flow pump, the head and brake horsepower both increase drastically near shutoff as shown in Fig. 7.

sect a8 fig06
Fig. 6 Mixed Flow Pump


sect a8 fig07
Fig. 7 Axial Flow Pump

The distinction between the above three classes is not absolute, and there are many pumps with characteristics falling somewhere between the three. For instance, the Francis vane impeller would have a characteristic between the radial and mixed flow classes. Most turbine pumps are also in this same range depending upon their specific speeds.

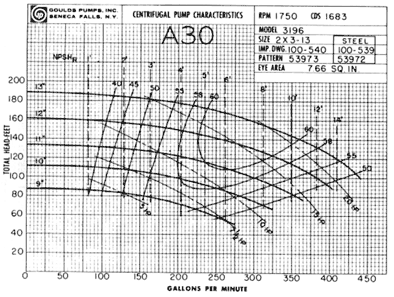
Fig. 8 below shows a typical pump curve as furnished by a manufacturer. It is a composite curve which tells at a glance what the pump will do at a given speed with various impeller diameters from maximum to minimum. Constant horsepower, efficiency, and NPSHR lines are superimposed over the various head curves. It is made up from individual test curves at various diameters.
sect a8 fig08
Fig. 8 Composite Performance Curve